Edit chart
Loading graph
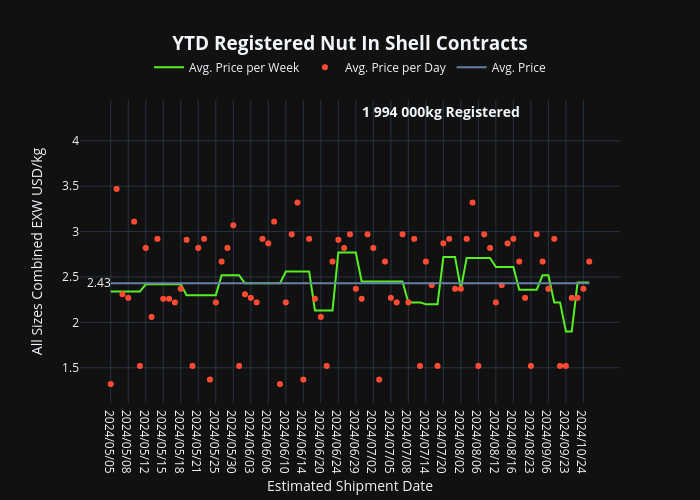
Gerhardmacsm.org's interactive graph and data of "YTD Registered Nut In Shell Contracts" is a line chart, showing Avg. Price per Week, Avg. Price per Day, Avg. Price; with Estimated Shipment Date in the x-axis and All Sizes Combined EXW USD/kg in the y-axis.. The x-axis shows values from -4.974264705882353 to 86.97426470588235. The y-axis shows values from 1.0992175096393741 to 4.45. This visualization has the following annotations: 1 994 000kg Registered; 2.43